How to find memory leaks in an iOS app

Memory is leaked in an iOS app when the system is unable to determine if an object allocated in memory is in use or not. The most frequent cause of memory leaks in iOS apps are retain cycles. Check out my previous post for a more detailed explanation of memory leaks in iOS apps. This post focuses on using Xcode tools to find and identify the causes of memory leaks in iOS apps.
To get started, you'll need to enable a couple settings in Xcode. Before enabling these settings, it is important note that you will want to make sure you disable the settings after you are done with your memory leak hunt. Both settings will have negative performance impacts if left enabled all the time.
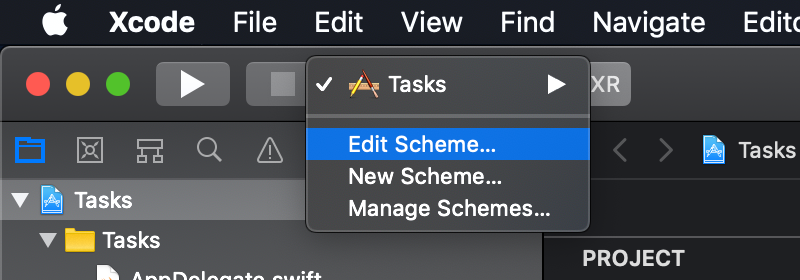
First, edit the scheme for your app in Xcode.
Click on the Run scheme and then select the Diagnostics section. There are two settings in this section that need to be enabled. The first is Malloc Scribble in the Memory Management group.
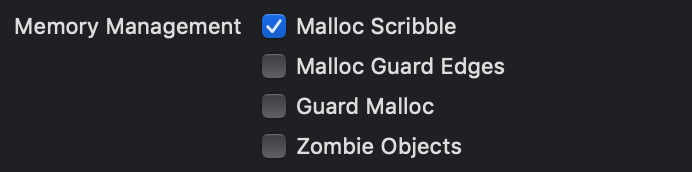
Enabling MallocScribble will fill freed memory with a predefined value that makes it more obvious when memory is leaked. This increases Xcode's accuracy of identifying leaks.
The second setting to enable is Malloc Stack in the Logging group.
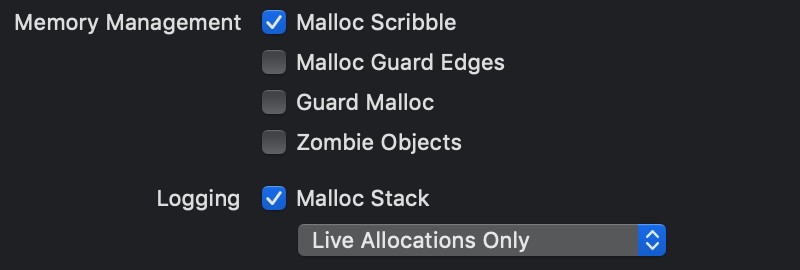
Enabling MallocStackLogging will allow Xcode to build an allocation backtrace to help you understand where objects are being referenced from.
That is all that is needed as far as configuring Xcode goes. Let's take a look at an example task manager app. If you are interesting in following along interactively, the source code is freely available on Github. Now let's get hunting for memory leaks. The example app consists of three main objects.
The first is TaskListViewController which is responsible for viewing tasks:
class TaskListViewController: UIViewController {

    @IBAction func showCreateTaskViewController() {
        let createTaskViewController = CreateTaskViewController()
        present(createTaskViewController, animated: true, completion: nil)
    }
}
The second is CreateTaskWorker which is responsible for creating a new task (i.e. saving it to a database):
protocol CreateTaskWorkerDelegate {
    func didCreateTask()
}

class CreateTaskWorker {

    var delegate: CreateTaskWorkerDelegate?

    func createTask(named name: String) {
        delegate?.didCreateTask()
    }
}
The last is CreateTaskViewController which is responsible for accepting user input for a new task and communicating it to the worker:
class CreateTaskViewController: UIViewController, CreateTaskWorkerDelegate {

    private let createTaskWorker = CreateTaskWorker()

    init() {
        super.init(nibName: "CreateTaskViewController", bundle: nil)
        createTaskWorker.delegate = self
    }

    @IBAction func createTask() {
        createTaskWorker.createTask(named: "Pay bills")
    }

    @IBAction func dismiss() {
        dismiss(animated: true, completion: nil)
    }

    func didCreateTask() {
        print("Task created")
    }
}
TaskListViewController presents CreateTaskViewController. Tap through the flow a couples times:
- Tap New Task button (CreateTaskViewController is presented)
- Tap Dismiss button (CreateTaskViewController is dismissed)
Now, click on the Debug Memory Graph button in Xcode's Variables View at the bottom left.
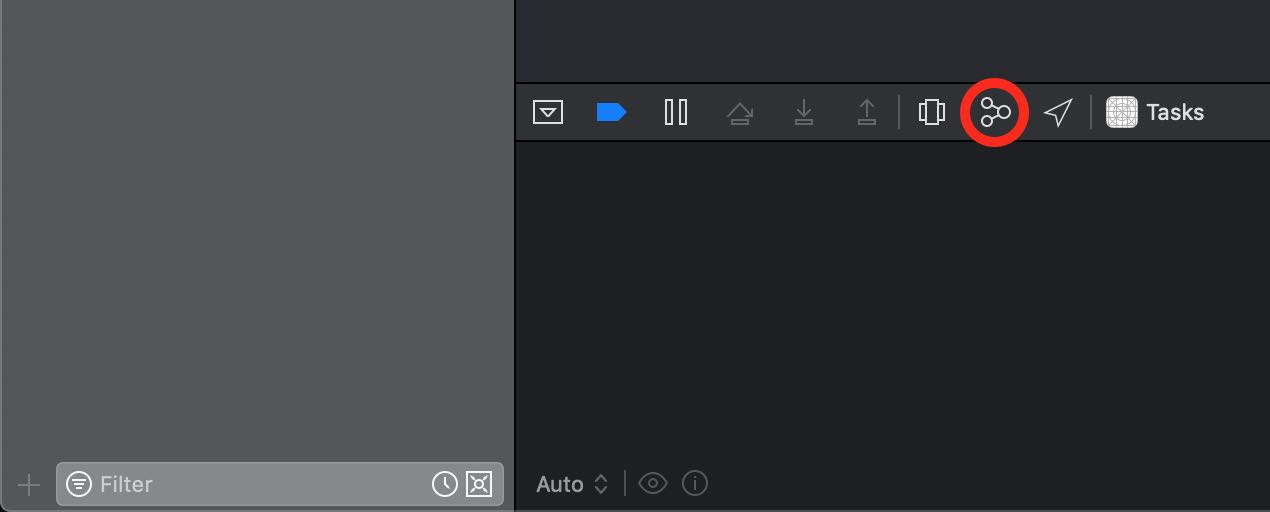
This will load the application's memory graph. Now, select the Debug tab in Xcode's Navigator pane on the left. This will bring up a list of all objects in memory.
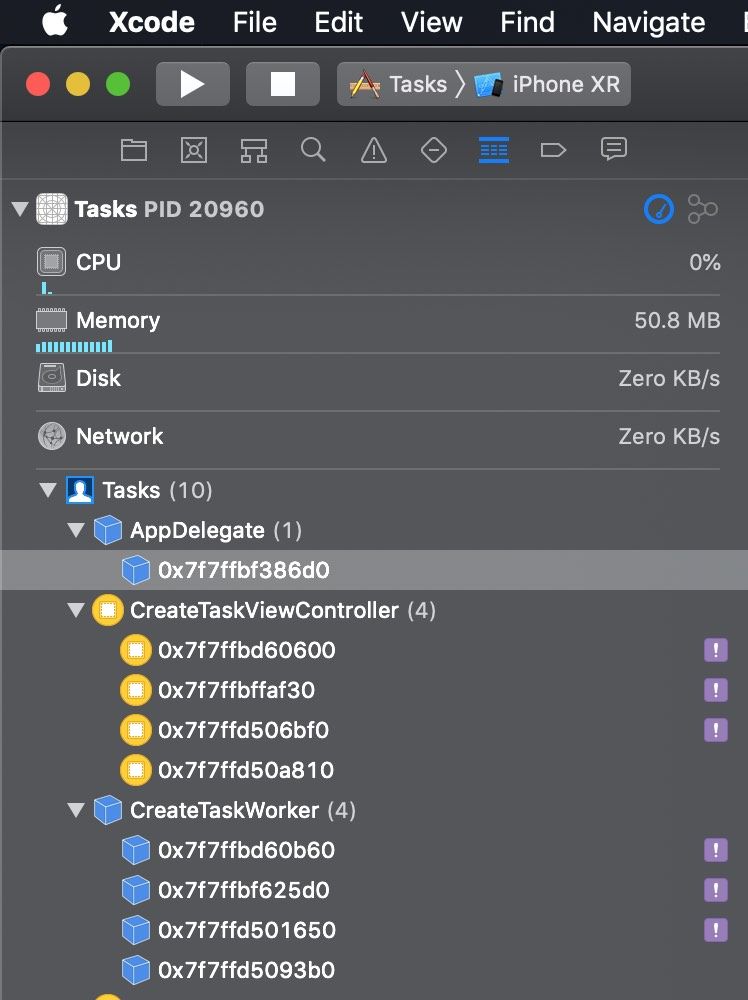
At this point, given that we have dismissed all instances of CreateTaskViewController, we should only expect to see a single instance of TaskListViewController here.
Notice that there are instances of CreateTaskViewController with a purple exclamation point icon next to it. This is Xcode indicating that an object has been leaked.
This post is focused more on identifying memory leaks and less on why they are occurring. To gain a better understanding of why this memory leak is occuring, read my previous article: A detailed explanation of memory leaks in iOS apps.
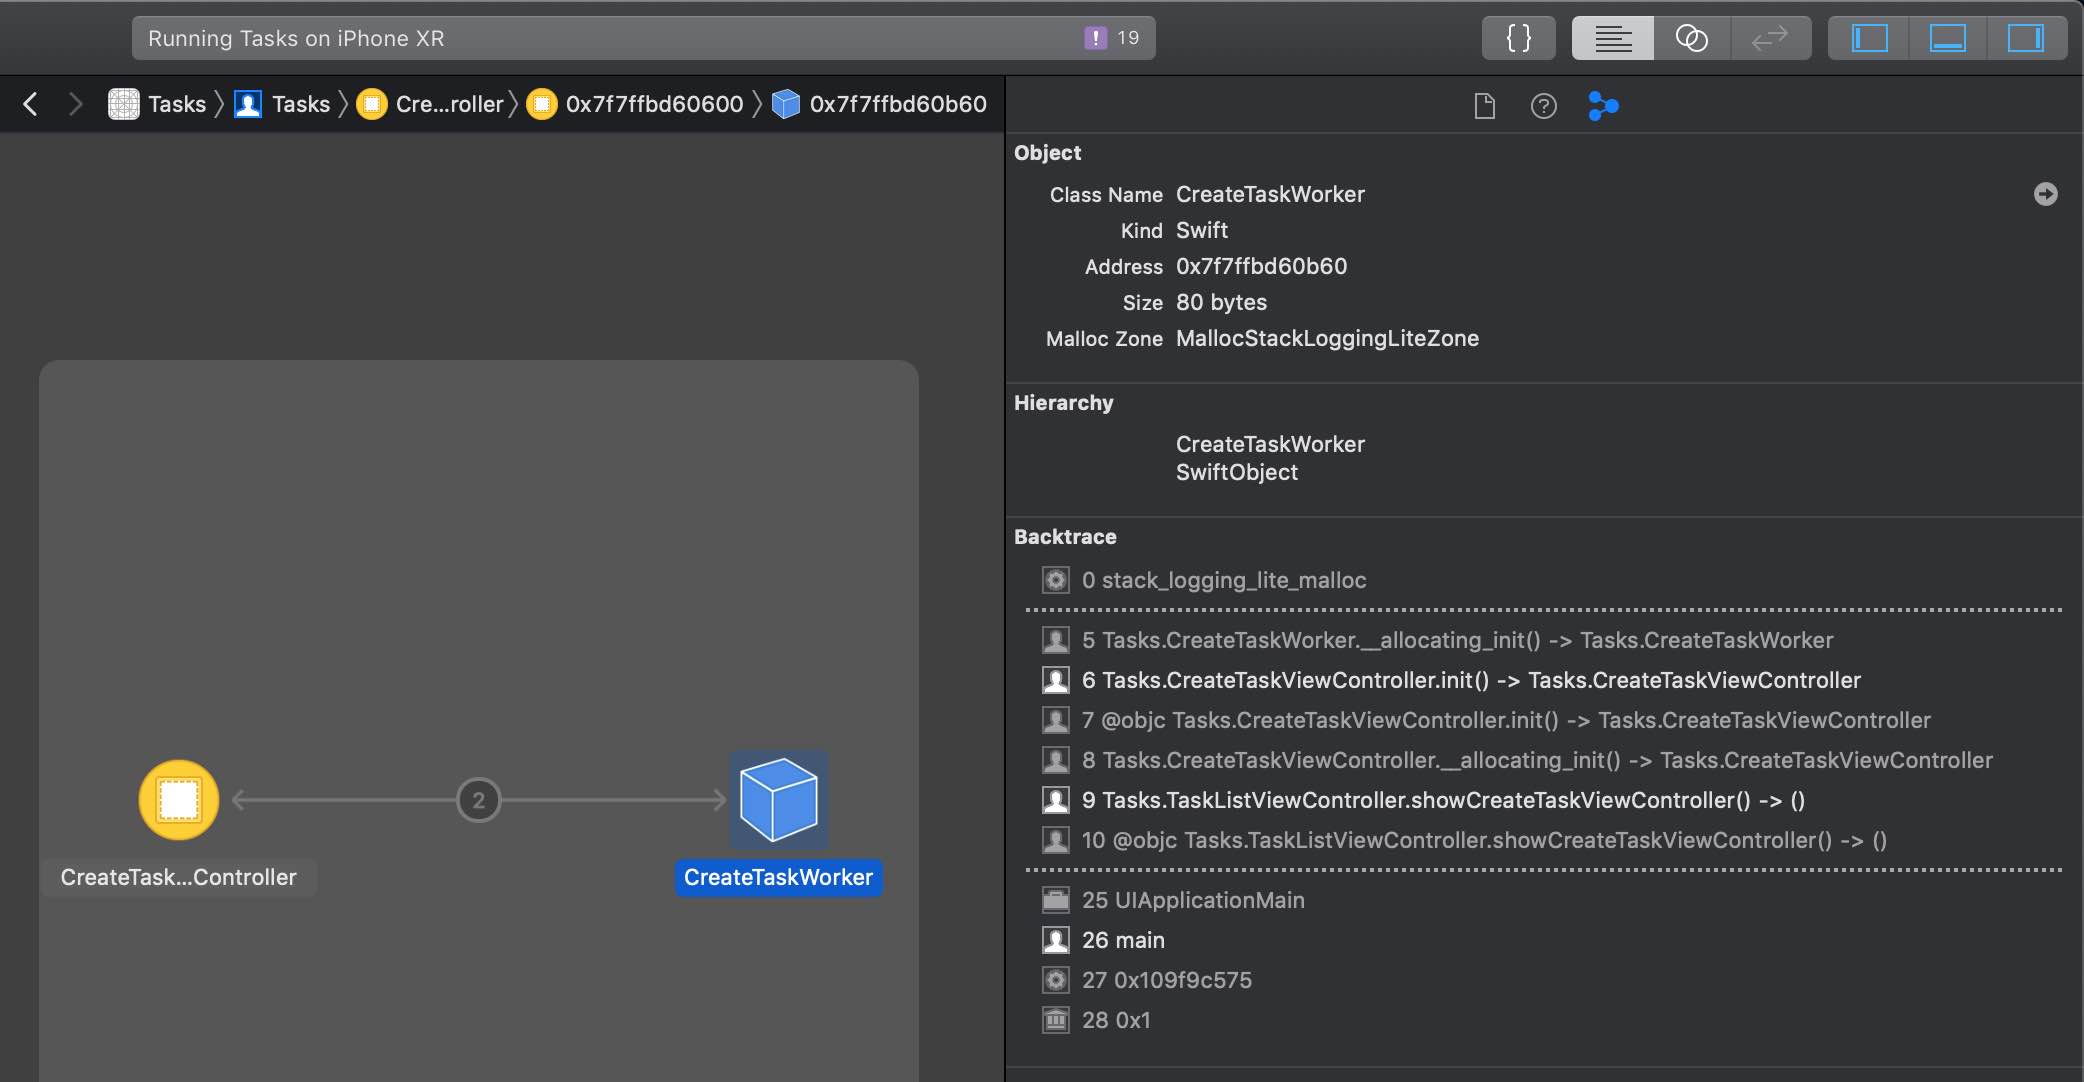
If you click on one of the instances in debug navigator, it will present you with a relationship graph. This view is extremely helpful for understanding which references are still being held as well as for tracking down where references are created.
Now that we found our memory leak, we can go about fixing it. For this particular example, all it takes is denoting the delegate in CreateTaskWorker as weak:
protocol CreateTaskWorkerDelegate: class {
    func didCreateTask()
}

class CreateTaskWorker {

    weak var delegate: CreateTaskWorkerDelegate?

    func createTask(named name: String) {
        delegate?.didCreateTask()
    }
}
If you make these changes and re-run the Tasks app, you'll notice that the memory leak no longer occurs.
Congrats! You are now ready to go out and find memory leaks in iOS apps. These debugging tools are incredibly powerful and can provide deep insight into the inner workings of of your application.
Xcode is not always 100% accurate with identifying memory leaks as seen in the screenshot above where only 3 out of the 4 leaked instances each of CreateTaskWorker and CreateTaskViewController were marked by Xcode as leaked.
Furthermore, some retain cycles, one of the most common causes of memory leaks in iOS apps, don't last forever, but still last long enough to cause issues. The method outlined in this article will work for identifying these cases, but only if you trigger the memory graph while the retain cycle is occuring. Otherwise, the objects will be deallocated if you wait too long. Look out for a future article with further strategies for debugging these cases as they are more common that you might think!
Lastly, don't forget to turn off the MallocScribble and MallocStackLogging settings in the run scheme for your app and you are done hunting for memory leaks. This will have a negative performance impact otherwise.